Bulk Transcriptomics
Pipeline overview
Genomebeans bulk transcriptomics pipeline is a bioinformatics sequencing data analysis tool supports an extensive workflow for the analysis and visualization of RNA-Seq data. It allows you to analyze your RNA sequencing data. Bulk transcriptomics is an application of next generation sequencing where RNA is reverse transcribed into cDNA with the help of reverse transcriptase to get information about RNA content of cell, which helps us to understand about gene expression and enrichment analysis.
The workflow processes raw data from FastQ inputs, aligns the reads, generates counts relative to genes and performs extensive quality-control on the results. These results are made available to you via two interactive reports, and a data package with all essential intermediate files to perform more in-depth data analysis. The pre-processing workflow processes your raw sequence data until QC approved aligned data.
See the pipeline page for a more detailed overview.
Do you have any question about these results? Just email us at support@genomebeans.com
Report info
- Generated on
- Oct 12, 2022 04:33 PM
- Experiment
- EX0000000128
- Title
- Melanoma
- Pipeline
- Bulk Transcriptomics
- Report
- Post-processing Report
- Species Build
- homo_sapiens - hg19
Metadata
The metadata is collected from samplesheet
| Sample | Group ID |
|---|---|
| A | A |
| B | A |
| C | B |
| D | B |
Mean-Variance Trend
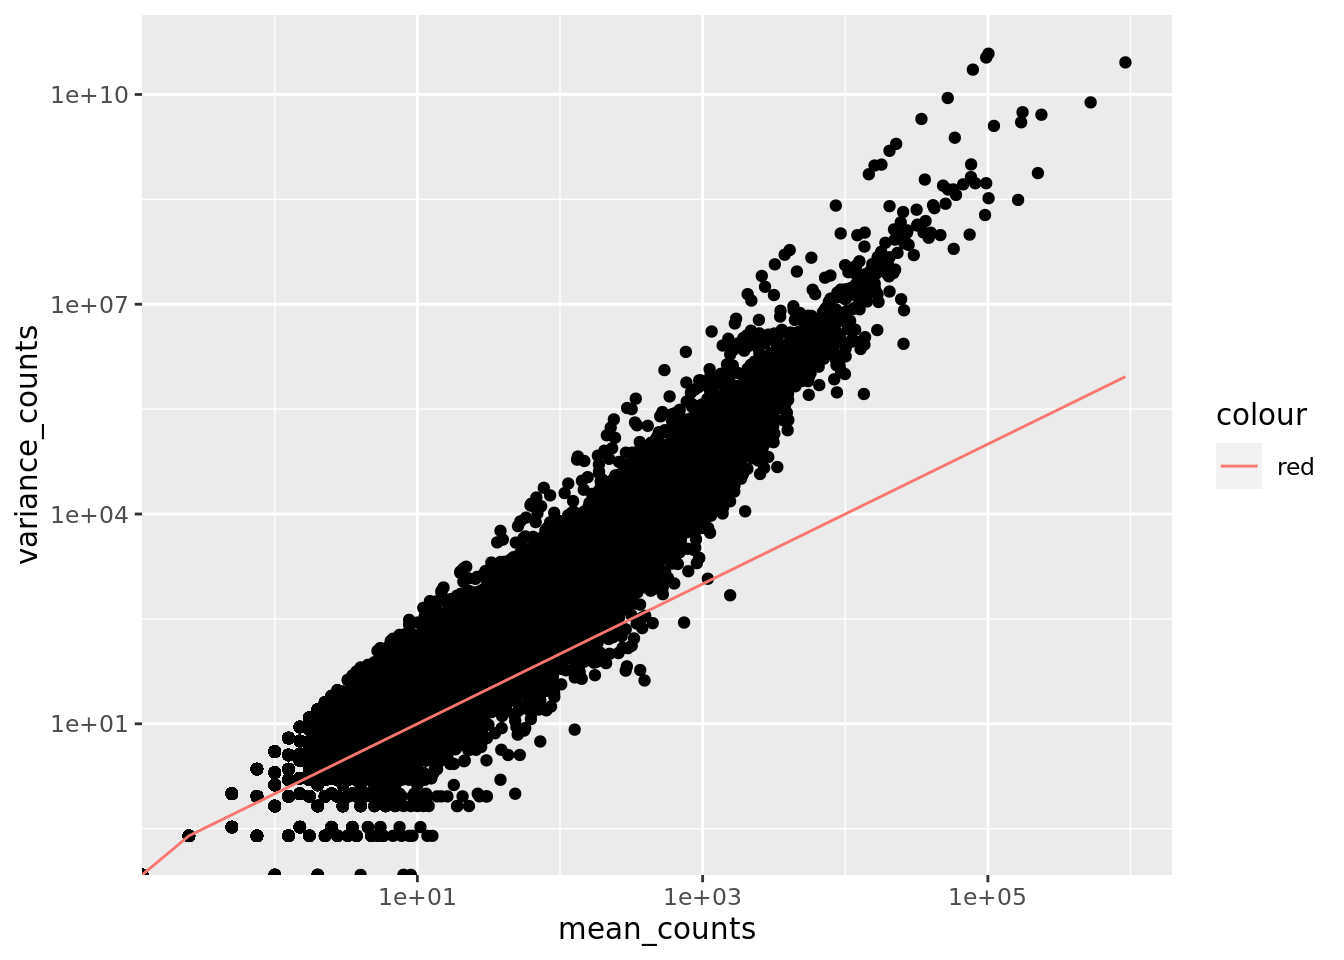
The DESeq2 dispersion, a measure of spread or variability in data, estimates are inversely related to the mean and directly related to variance. Based on this, the dispersion is higher for small mean counts and lower for large mean counts. The dispersion estimates for genes with the same mean will differ only based on their variance. Therefore, the dispersion estimates reflect the variance in gene expression for a given mean value.
The plot of mean versus variance in count data below shows the variance in gene expression increases with the mean expression (each black dot is a gene). The relationship between mean and variance is linear on the log scale, and for higher means, we could predict the variance relatively accurately given the mean. However, for low mean counts, the variance estimates have a much larger spread; therefore, the dispersion estimates will differ much more between genes with small means.
Differential Expression (DGE) analysis
Differential expression analysis is performed using DESeq2 which estimate variance-mean dependence in count data from high-throughput sequencing assays and test for differential expression based on a model using the negative binomial distribution.
Gene Level Quality Control
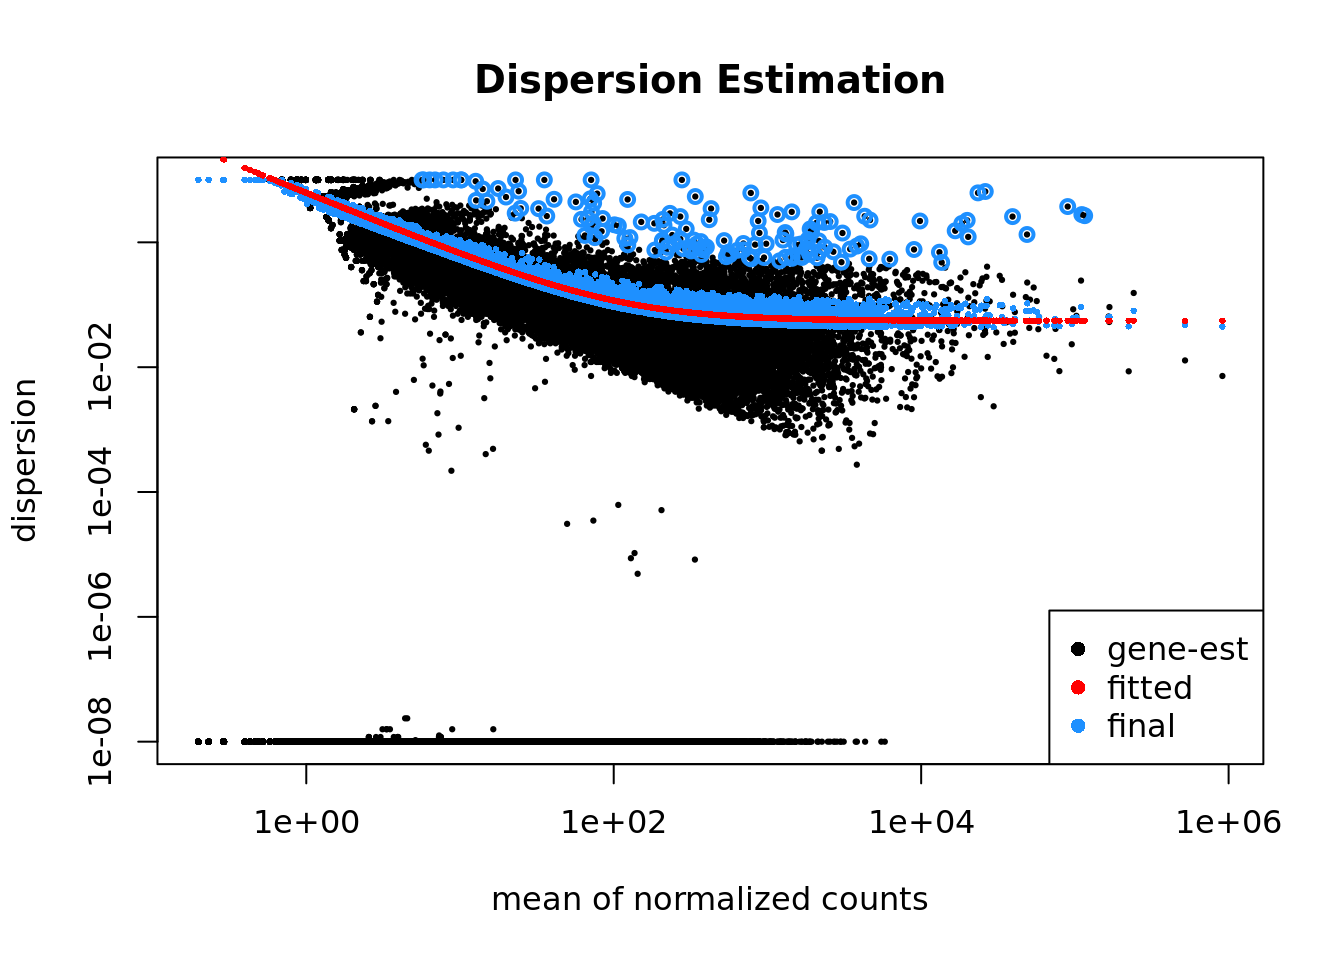
DESeq package will also omit genes that have low or no chance of being detected as differentially expressed. This will increase the power to detect differentially expressed genes.
The genes omitted fall into three categories:
- Genes with zero counts in all samples
- Genes with an extreme count outlie
- Genes with a low mean normalized counts
This plot shows per-gene dispersion estimates together with the fitted mean-dispersion relationship.
PCA
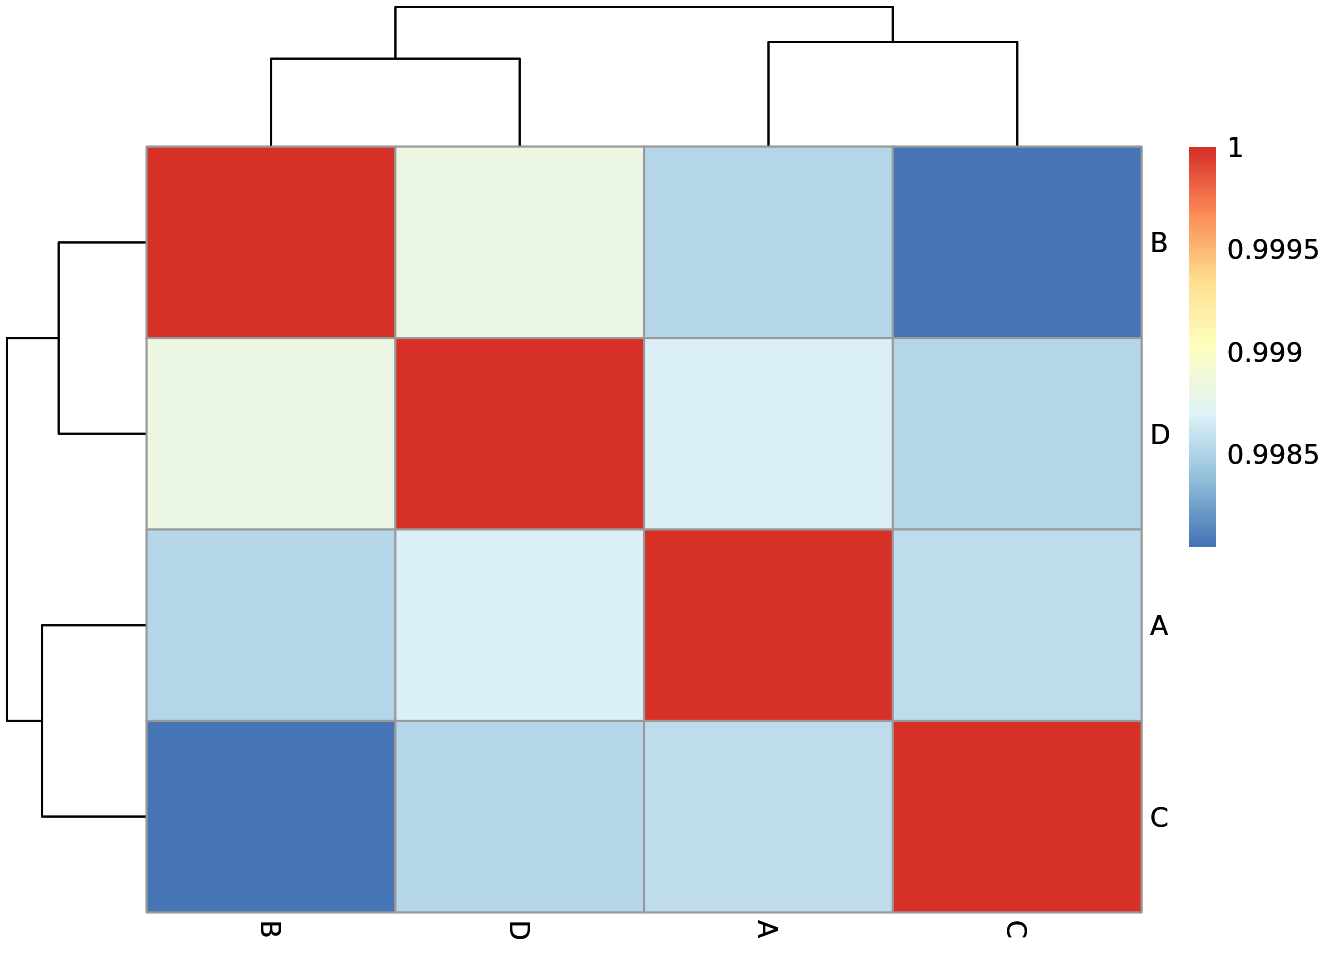
Principal component analysis, or PCA, is a statistical procedure that allows you to summarize the information content in large data tables by means of a smaller set of “summary indices” that can be more easily visualized and analyzed (dimensionality reduction).
DESeq2 uses a regularized log transform (rlog) of the normalized counts for sample-level QC as it moderates the variance across the mean, improving the clustering. It aim to remove the dependence of the variance on the mean. In particular, genes with low expression level and therefore low read counts tend to have high variance, which is not removed efficiently by the ordinary logarithmic transformation.
The chosen technique to transform normalized counts here: rlog
Volcano Plot
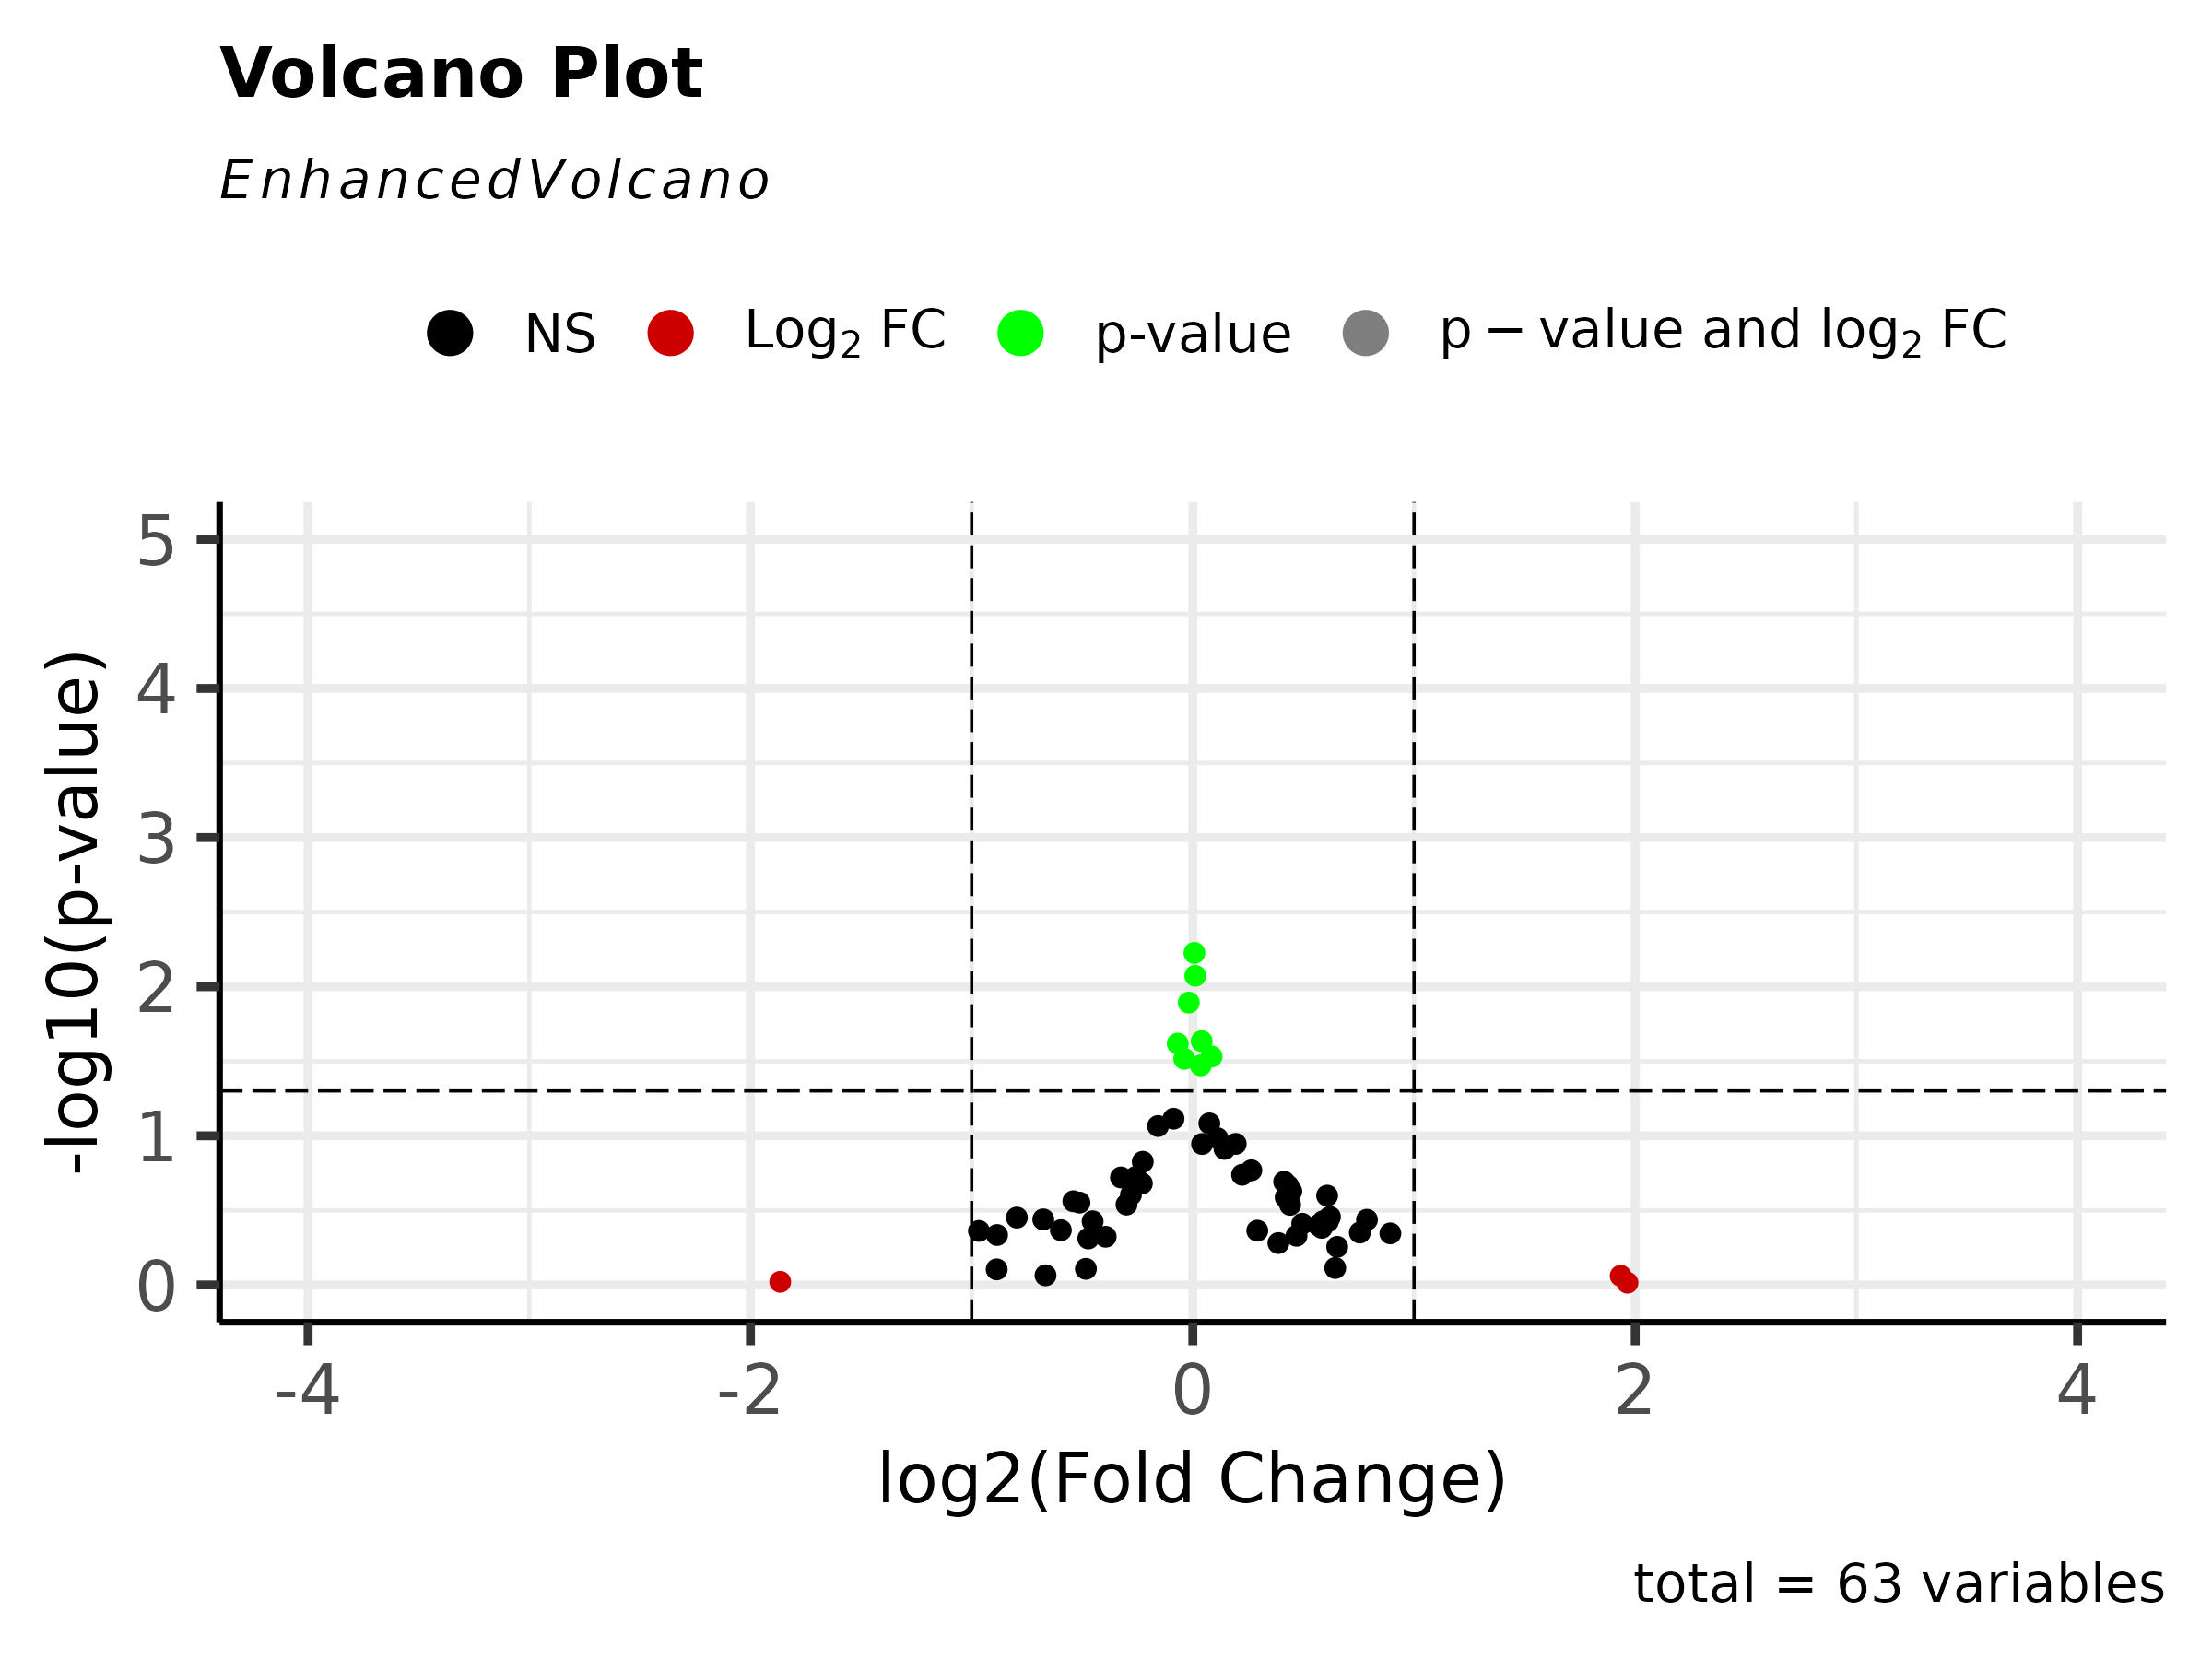
A volcano plot is useful for identifying events that differ significantly between two groups of experimental subjects. The volcano plot illustrates the log[10]-transformed adjusted p-Value against the log-fold change for each probe in the assay. Each point on the graph represents a gene. The log2-fold differences between the groups are plotted on the x-axis and the -log10 p-value differences are plotted on the y-axis. The horizontal dashed line represents the significance threshold specified in the analysis, usually derived using a multiple testing correction.
Genes whose expression is decreased versus the comparison group are located to the left of zero on the x-axis while genes whose expression is increased are illustrated to the right of zero. Genes with statistically significant differential expression lie above a horizontal threshold. Closer to zero indicates less change while moving away from zero in either direction indicates more change. Volcano plots provide an effective means for visualizing the direction, magnitude, and significance of changes in gene expression.


